New Human Physiology | Paulev-Zubieta 2nd Edition
Chapter 15: Blood Gas Transport and Disorders
| HOME | PREFACE | TABLE OF CONTENTS | SYMBOLS | SECTION INFO | CONTRIBUTORS | LINKS | CONTACT US |
Highlights
Study_ObjectivesPrinciplesDefinitionsEssentials
PathophysiologyEquationsSelf-AssessmentAnswers
Further Reading
|
Chapter 15
|
 |
||||||||||||||||||||||||
|
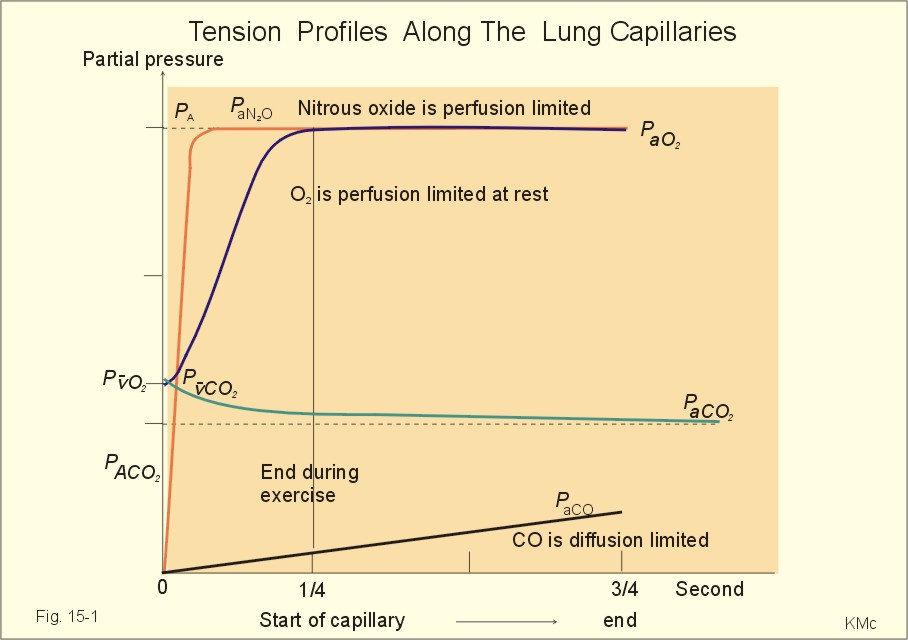
· To define the oxygen binding capacity and oxygen saturation of blood, the standard affinity between oxygen and haemoglobin and its reciprocal value (P50), hypoxia, cyanosis, and anaemia. · To describe organs with low and high oxygen extraction from the blood, carbon monoxide poisoning, cyanide poisoning, and the measurement principle for blood gas electrodes. · To draw the dissociation curve for oxyhaemoglobin and for carbon dioxide in whole blood and explain the function of the factors involved. · To calculate blood concentrations from partial pressures of gases (Henrys law), to calculate one variable when relevant variables are given. · To explain the oxygen, carbon monoxide and carbon dioxide binding to haemoglobin, the Bohr-and Haldane-shifts, and the changes from arterial to venous red cells (increased red cell volume and the water and chloride-bicarbonate shift). To explain the oxygen and carbon dioxide stores in the body, the oxyhaemoglobin dissociation and its importance for the oxygen uptake in the lungs and its delivery to the tissues. · To use these concepts in problem solving and case histories. · Oxygen is transported through the thin lung barrier by diffusion, and reaches the respiring cells via bulk transport in the blood and a final diffusion across the capillary barrier to reach the mitochondria of tissue cells. · Fick’s law of diffusion (see Chapter 1). · Bohr effect: The dissociation curve for Oxy-haemoglobin is shifted to the right with increasing carbon dioxide or proton concentration in blood. · Cyanosis refers to the bluish colour of skin, nails, lips and mucous membranes. Visible cyanosis implies more than 50 g of the bluish deoxyhaemoglobin per l of mean capillary blood. · Haldane effect: For similar carbon dioxide tensions, the carbon dioxide binding capacity of oxy-haemoglobin is reduced compared to deoxyhaemoglobin. · Normal haemoglobin concentration (mean for males) is 149 g haemoglobin l-1 of blood, which is equal to 9.18 mM (internationally accepted as 100%). The normal range is 130- 160 g haemoglobin l-1 of blood. · Oxygen binding capacity of haemoglobin is defined as the volume of O2 that binds to 1 g of haemoglobin at the normal, ambient conditions of 20 kPa (150 mm Hg) in partial pressure: 1.34 ml O2 STPD g-1. · Oxygen saturation of blood (S). SaO2 is the percentage of haemoglobin present as oxyhaemoglobin, normally 0.97-0.99 in arterial blood. The normal saturation of mixed venous blood is 0.75 at rest. · Standard affinity of haemoglobin for O2 is defined as the reaction rate between oxygen and haemoglobin, when haemoglobin is 50% oxygenated. · P50 : The O2 partial pressure at 50% oxygenation of haemoglobin is a practical estimate of standard affinity. A low P50 signals high standard affinity and vice versa. This paragraph deals with 1. Transfer of gases between blood and alveolar air, 2. Haemoglobin and the dissociation curve, 3. Standard affinity, 4. Blood-tissue exchange, and 5. Venous blood transport. 1. Transfer between blood and alveolar air Oxygen is transported from the alveolar air to the red blood cells by diffusion across the alveolar-capillary barrier. The transit time for the red cells to pass through the approximately 1 mm long lung capillaries (3/4 s) is virtually always adequate for the haemoglobin to become fully saturated with the oxygen of the alveolar gas (Fig. 15-1). Diffusion-limitation is not present in healthy persons and carbon dioxide diffuses better than oxygen. The arterial blood gas tensions are ideal informers about the status of blood and lung gas exchange. A gas such as carbon monoxide (CO) that does not equilibrate across the alveolo-capillary barrier, such that its pressure gradient is maintained while the blood is still in transit through a pulmonary capillary, is purely diffusion limited, and is not dependent on the bloodflow per se (no perfusion limitation).
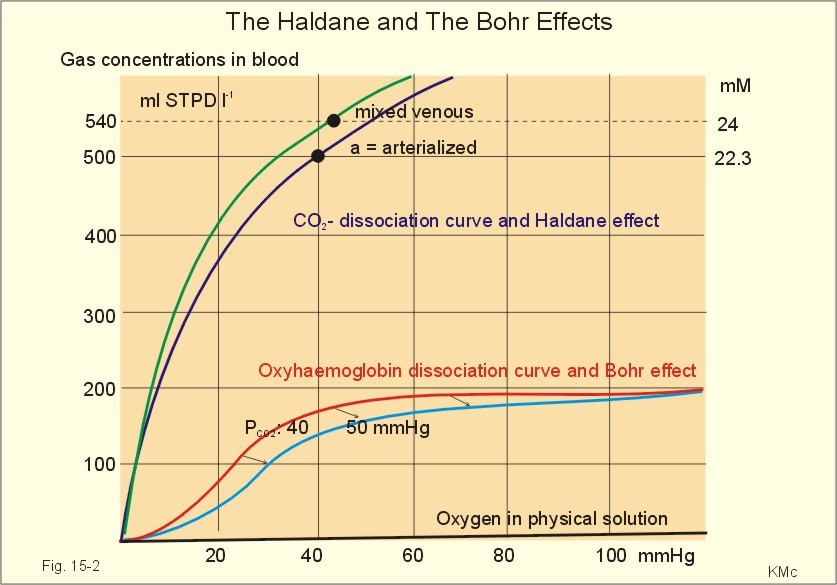
Fig. 15-1: Pulmonary tension profiles for different gases along the lung capillary (at rest and during exercise). gases, such as hydrogen, nitrogen, nitrous oxide, tritium, 133Xe, and anaesthetic gases, that equilibrate rapidly across the alveolo-capillary barrier are perfusion limited. Soon after the blood has entered the pulmonary capillary, the partial pressure for the gas in the blood becomes equal to that in the alveoli. No additional diffusion of this gas will occur during the remaining transit time of the blood in the pulmonary capillary. The pulmonary transfer of O2 and CO2 is perfusion limited over a wide range of activity levels. Even though CO2 is 24-times more soluble in water and diffuses 20 times faster through water than does O2, the two gases have essentially the same pulmonary equilibration times (which is 0.25 s when blood has passed one third of the way through the capillary at rest). The equilibrium time is due to the small pressure gradient for CO2 and the time needed for conversion of bicarbonate and carbamino-compounds to dissolved CO2. A perfect matching between alveolar air and capillary blood as described above does not occur throughout the whole lung. Even in healthy persons alveolar ventilation/perfusion inequalities disturb the ideal exchange. A variable part of the venous blood reaches the arterial side without passing ventilated regions of the lungs. This is termed a functional shunt or veno-arterial shunting. 2. Haemoglobin and the dissociation curve The red cell, erythropoiesis and anaemia are described in Chapter 8. Oxygen is transported by haemoglobin, but also carbon dioxide (CO2) and hydrogen ions (H+) are being transported in the blood with a minimal pH change. Hb4(O2)4 + CO2 + H+ Û Hb4CO2(H+) + 4O2 According to Henry’s Law the concentration of physically dissolved O2, [O2] is directly proportional, to its partial pressure in the blood. In the lungs, the concentration is high (due to the high partial pressure); hence the reaction is shifted to the left. This results in the release of CO2 and the oxygenation of haemoglobin. In the muscles, the [O2] is falling (due to mitochondrial consumption of O2); hence the reaction is shifted to the right, which results in uptake of carbon dioxide and the release of O2 and reduced haemoglobin. The percentage of the total haemoglobin concentration present as oxyhaemoglobin is termed the oxygen saturation (SO2) of haemoglobin. The total CO2-concentration of blood rises with the PaCO2, and the CO2-dissociation curve is almost linear in the physiological range between 40 and 50 mmHg (Fig. 15-2). In mixed venous blood the oxygen saturation (SO2) is 75% and the CO2-concentration is larger for a given PCO2 than in arterial blood (Fig. 15-2). This is a general relationship called the Haldane effect: Oxyhaemoglobin is not able to bind as much CO2 as oxygen-free haemoglobin. The Haldane effect facilitates the release of carbon dioxide in the lungs (Fig. 15-2). The reaction of oxygen with haemoglobin follows the law of mass action. The concentration of oxygen in physical solution is proportional to the oxygen partial pressure (Eq. 13-6). Thus, the concentration of physically dissolved oxygen determines the relative amounts of haemoglobin and oxyhaemoglobin or the SO2, which varies from zero to 100%. The Oxy-haemoglobin dissociation curve is shown in Fig. 15-2. As the PCO2 of blood increases, the affinity of oxygen for haemoglobin is reduced. Since the pH of blood is closely related to the PCO2, the following statement is also true: As the pH of blood decreases, the affinity of oxygen for haemoglobin is reduced. Hereby, the slope of the oxyhaemoglobin dissociation curve decreases and shifts to the right. This phenomenon is called the Bohr effect, and the effect assists the exchange of oxygen in the tissues (Fig. 15-2).
Fig. 15-2: The concentration curves for oxygen and for carbon dioxide in blood as a function of increasing blood gas tensions. The Haldane and the Bohr effects are shown. The reaction between protons and bicarbonate is shifted to the right when the H+-concentration rises: H+ + HCO3- Û H2CO3 * Û H2O + CO2. The last reaction is catalysed by carbonanhydrase (*). In fully oxygenated pulmonary blood, the oxygen concentration is approximately 200 ml STPD per l (SO2 = 1.0 or 100%) at an atmospheric oxygen partial pressure of 20 kPa and a PaO2 of 13.3 kPa (Fig. 15-3). This fully oxygenated blood is mixed with venous blood that passes through the physiological shunt on its way to the left heart. Thus, the oxygen tension falls to 12.6 kPa (95 mmHg) in arterial blood from 13.3 kPa at the pulmonary capillaries and SaO2 is only 0.985 (Fig. 15- 3). The solubility coefficient of oxygen is 0.022 ml STPD per ml per atmosphere (found in Table 13-1). From the dissociation curve, SaO2 is read to be 0.985 (Fig. 15-3). The chemically bound O2: (0.985 × 200) is thus 197 and the physically bound is [(0.022 * 12.6/101.3)*1000] 2.75, or a total of 199.75 ml STPD per l of blood.
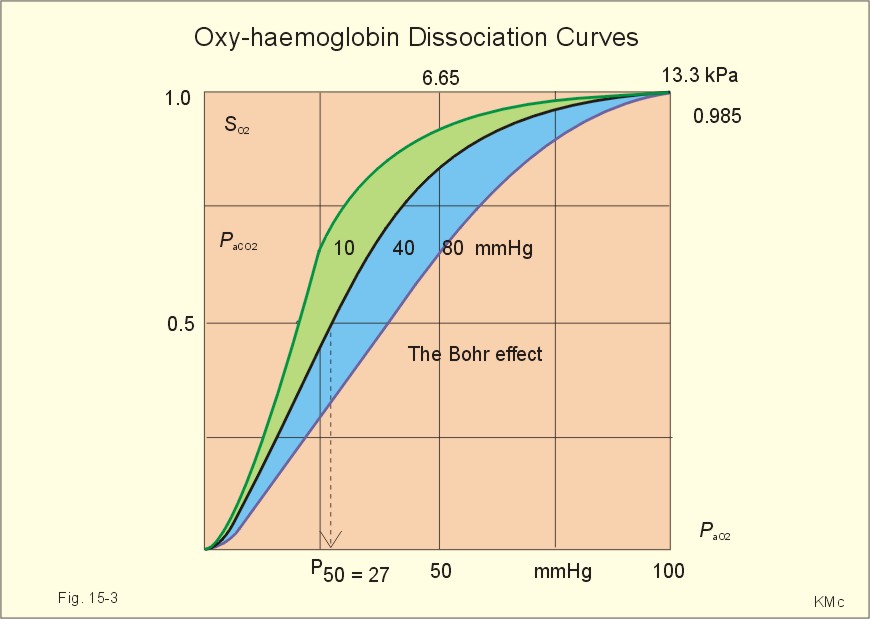
Fig. 15-3: The Oxy-haemoglobin dissociation curves. The O2 - pressure is given in kPa and in mmHg. Standard affinity of haemoglobin for O2 binding is defined as the reaction rate when haemoglobin is 50% oxygenated. The standard affinity of haemoglobin for oxygen is therefore the slope of the dissociation curve when haemoglobin is 50% oxygenated. A practical expression for standard affinity is the O2 partial pressure at 50% oxygenation - called P50 (ie, the reciprocal value of standard affinity). A metabolite of anaerobic glycolysis called 2,3- DPG (diphosphoglycerate) is highly concentrated in erythrocytes (1 mol per mol of Hb4). Red cells contain a 2,3-DPG mutase and lack mitochondria, so they are confined to anaerobic glycolysis. The highest 2,3-DPG values are found during hypoxia and during exercise. The 2,3-DPG, like H+ and CO2, facilitates the unloading of O2 from haemoglobin by reversible changes of its molecular configuration at low oxygen tensions (see Fig. 8-3). The following factors shift the oxygen dissociation curve to the right (increase P50): 1. Increasing PC02 (the Bohr effect), 2. increasing [H+], 3. increasing 2,3-DPG, 4. increasing temperature. The metabolic activity of the cells augment these factors, and means that less O2 is bound to haemoglobin at a given PaO2 (metabolic activity facilitates unloading of O2). The factors that shift the oxygen dissociation curve to the left (low P50) are 1. Increasing O2 tension (the Haldane-effect), 2. decreasing [H+] and PaCO2, 3. low temperature in the lungs. 4. Increasing CO tension, 5. Reduced 2,3-DPG production in chronic acidosis, and by 6. Foetal haemoglobin. The leftward shift in the lung means that more O2 is bound to haemoglobin at a given PaO2 (facilitates the binding of O2 to haemoglobin). Foetal haemoglobin (F) contains 2 gamma-chains in stead of the 2 b-chains of Adult (A) haemoglobin. Haemoglobin F binds 2,3-DPG less tightly than does heamoglobin A, and therefore oxygen more tightly. The sigmoid dissociation curve of haemoglobin F is clearly shifted to the left (low P50) relative to haemoglobin A. Also species differences in the globin part affect the curve. Tissue diffusion is the rate-limiting process for oxygen transport. The oxyhaemoglobin saturation curve (Fig. 15-3) shows that the PO2 must fall appreciably before an important quantity of oxygen dissociates from haemoglobin. The gas tensions of the mixed venous blood provide the best information about the respiratory gas tensions of the tissues. However, mixed venous blood is obtainable only by invasive procedures. Fick’s diffusion law governs the transfer of gas. This law states that the amount of gas transferred from blood to a certain mitochondrial site is directly related to the partial pressure gradient (DP = mean systemic capillary minus mean tissue oxygen tension), area of the systemic capillary barrier (A), and solubility of the gas (a, see Table 13-1). The flux of gas is inversely related to the length of the diffusion pathway from the capillaries to the mitochondria (L), and the square root of the molecular weight of the gas. Marie Krogh incorporated solubility (Bunsen’s a), molecular weight (mol. weight), A, and L in her lung diffusion constant (DL) and by analogy we can define a mitochondrial diffusion constant (Dm) equal to the solubility (a) divided by the square root of the mol. weight. The diffusion distance from the capillary blood through the tissues to the mitochondria is long in many organs. Here, the conditions are less favourable and diffusion-limitation is sometimes present in cells at the far end of the capillaries, although their mitochondria can maintain oxidative metabolism even at 1 mmHg (0.133 kPa). The diffusion volume of O2 per time unit is V°O2, and this must equal (Dm × DP) – see Eq. 14-2. Oxygen equilibrates rapidly across the peripheral tissue barrier, but its transport is perfusion limited. The DP depends upon the bloodflow through each capillary, the density of open capillaries, and their degree of dilatation. The PaO2 is kept high by O2 released from oxyhaemoglobin, and the steep dissociation curve shows the substantial O2 delivery to the mitochondria. Apart from the factors leading to increased PO2, all factors, which imply a rise in V° O2, are also important. The force driving oxygen to the most distant mitochondria is often small. Fortunately, mitochondria have the capacity to maintain oxidative metabolism at a tissue tension as low as 133 Pa or one mmHg. Even such a low PO2 increases the rate of the respiratory chain events. Most tissues have a diffusion pathway of 1-10 mm or more. This is particularly critical in brain and heart tissues, whereas the even longer diffusion distance in resting muscle tissue is of minor consequence. The only way in which the diffusion distance can be reduced is by recruitment of more capillaries at increasing demand. This is particularly important in skeletal muscles during exercise, where the capillary density increases threefold. Such a rise increases the systemic, capillary surface area, simultaneously with the decrease in diffusion distance. In the muscle capillaries bloodflow is interrupted during the contraction phase, and the tissue-PO2 falls toward zero. At low PO2, the gradient of the dissociation curve of myoglobin is at its steepest. Hence, myoglobin releases its O2 readily. During muscular relaxation, bloodflow is restored and myoglobin is rapidly reloaded with oxygen. The myoglobin dissociation curve has a P50 some five-fold lower than that of haemoglobin. The diffusion constant is equal to a divided by the square root of the mol. weight. The square root of the molecular weights of oxygen and carbin dioxide (square root of 32/44) is 0.85. This result is obtained by solving the equations for CO2 and O2. The ratio of their solubility is 0.51/0.022 = 23.2. The rate of CO2 diffusion is twenty-fold (23.2 × 0.85 = 20) greater than that of O2. The flat plateau part going towards right (Fig. 15-3) provides a rapidly available O2 store. The PaO2 can fall from 13.3 to 8.7 kPa (100 to 65 mmHg) with little change in SaO2. Almost the same mass of O2 will attach to haemoglobin. The steep, middle portion of the curve allows cell mitochondria to extract relatively large quantities of O2 from haemoglobin with relatively small changes in the PaO2 - and PaO2 is high enough to maintain diffusive force. The heart at rest consumes 140 ml O2 per l of blood out of the 200 ml per l that is supplied by the coronary arteries. The venous oxygen saturation in the coronary sinus is therefore (200 - 140)/200 = 0.30 at rest. Thus, increases in the myocardial O2 uptake during exercise are mainly met by an increase in bloodflow. Intensively working skeletal muscles - just like the myocardium at rest - utilise 140- 170 ml O2 per l of blood. The main part of the cardiac output is directed for exercising muscles during severe work. The arterio-venous O2 content difference for the total muscle mass will become almost equal to that of the entire body. The typical capillary passage period for blood is 0.75-1 second (s). Oxygen is rapidly released from haemoglobin. At the venous end of the capillary the most distant mitochondrion has the poorest oxygen supply. Oxygen diffuses through the red cell membrane, blood plasma, and the endothelial cell into the ISF with a rate, which is 20 times slower than that of CO2 diffusion. The lipid solubility of O2, CO2, and N2 are high. These gases dissolve in the lipid layer of cellular membranes and diffuse into the cell. Oxygen diffuses to the mitochondria without barrier problems as long as the critical PO2 gradient is maintained. Hypoxic tissue may function down to a tissue PO2 of only 1 mmHg. 5. Transport in the venous blood Carbon dioxide is the most important final product of cellular metabolism, since it operates as a control molecule in essential regulatory processes linking the size of ventilation to cardiac output and influencing vascular resistance. The venous blood carries carbon dioxide to the lungs, where it is eliminated in the expired air by ventilatory effort. Our blood contains large quantities of carbon dioxide. The [total CO2] in arterial blood is 500 ml STPD per l (22.3 mM), and in venous blood 540 ml STPD per l (24 mM). The solubility coefficient for CO2 is 0.51 ml STPD per ml and per 101.3 kPa (see Table 13-1), PaCO2 is 5.3 and the mixed venous PCO2 is 6.1 kPa (Table 14-1). There are three types of CO2 transport from the cells to the lungs: a. The physically dissolved CO2 concentration is calculated by application of Henrys law: (0.51 × 1000* D P/101.3). One mmol equals 22.4 ml. The results are for arterial blood: 26.7 ml STPD per l (or 26.7/22.4= 1.19 mM), and for mixed venous blood: 30.7 ml STPD per l (or 30.7/22.4= 1.37 mM). The difference (30.7 - 26.7) equals 4 or 4/22.4 = 0.18 mM dissolved CO2. Because CO2 is 24 times more soluble than O2, dissolved CO2 is a more significant form of transport in the venous blood than is dissolved O2 in the arterial blood. b. Carbamino-haemoglobin. Terminal amine groups, primarily on haemoglobin, react with CO2: Hb-NH2 + CO2 Þ Hb-NH-COO- + H+. The concentration of CO2 binding compounds in arterial blood is 1 mM and in mixed venous blood 1.4 mM, so carbamino compounds account for 0.4 mM of the CO2 transported in blood. c. Bicarbonate. Some of the dissolved CO2 reacts with water, forming carbonic acid, which immediately breaks down to bicarbonate and H+: CO2 + H2O Û * H2CO3 Û H+ + HCO3-. This reaction is slow in plasma, but more than 10 000 times faster in the erythrocytes because of the presence of the enzyme carbonanhydrase (*), which catalyses the hydration of CO2 to carbonic acid. The H+ is buffered by the partially oxygenated haemoglobin. The bicarbonate diffuses out of the erythrocytes into plasma, thus preventing an accumulation, which would slow down the hydration of CO2 according to the law of mass action. Of the total CO2 in venous blood 2/3 occurs in the form of bicarbonate, and most of this is found in the plasma sink (Fig. 15-5) following exchange with Cl- (Fig. 15-5). The actual [bicarbonate] is calculated as follows: [Bicarbonate] = [Total CO2 - carbamino CO2 - dissolved CO2]. Arterial blood [bicarbonate]: 22.3 - 1 - 1.19 = 20.1 mM. Venous blood [bicarbonate]: 24 - 1.4 - 1.37 = 21.2 mM.
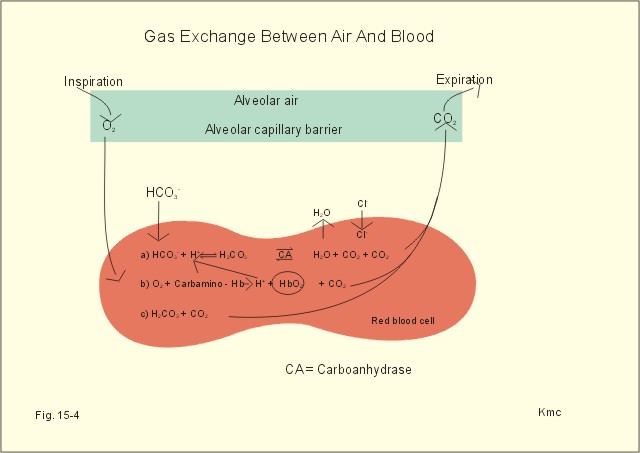
Fig. 15-4: Gas exchange between air and blood. Reactions in plasma and erythrocytes. As CO2 is being removed from the blood to the alveolar air, the equilibrium is shifted toward the formation of CO2 from bicarbonate according to the law of mass action (Fig. 15-4). This process, plus the binding of oxygen to haemoglobin causes both CO2 and H+ to dissociate from haemoglobin (Fig. 15-4). The released H+ then combines with bicarbonate to form more CO2 for diffusion (Fig. 15-4). Carboanhydrase (CA or *) in the red cell speeds up the CO2 formation. The CO2 from the cells enters the capillary blood, and is buffered primarily by haemoglobin (Fig. 15-5). Within milliseconds the red cell Carboanhydrase catalyses its hydration to form H2CO3, which dissociates to form H+ and bicarbonate. To avoid accumulation of bicarbonate, two out of three newly formed HCO3─ is exchanged for Cl- in plasma, through anion antiporters in the membrane (Fig. 15-5). This way the membrane potential is sustained. This bicarbonate-chloride shift occurs within milliseconds and is vital for the CO2 transport (Fig. 15-5). The bicarbonate-chloride shift occurs simultaneously with, and probably independent of, the release of Na+ and HCO3─ from erythrocytes into plasma probably by Na+-H+ exchange.
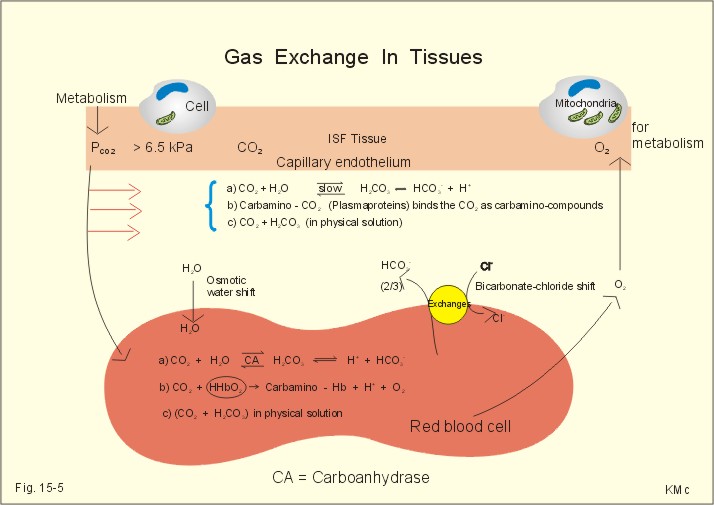
Fig. 15-5: CO2 diffusion from tissues to blood and oxygen diffusion from blood to tissues. CO2 is also rapidly bound to the amino groups of deoxyhaemoglobin (Hb) to form carbamino-groups and H+ within the erythrocyte (Fig. 15-5). When oxyhaemoglobin loses its O2, it can accept H+ , which combines with the NH moiety on the imidazol ring: O2-Fe.Hb-NH + H+ Þ O2 + Fe.Hb-NH2+. This allows more CO2 to be hydrolysed and be carried in the plasma sink as bicarbonate (Fig. 15-5). Thus, at a given PCO2 , the CO2 concentration at the venous end is greater than in arterial blood (the Haldane effect). There is a small rise in [CO2 + H2CO3] of 0.2 mM dissolved CO2 (Fig. 15-5). Venous erythrocytes contain more osmotically active particles than arterial red cells. Consequently, they swell because water from the plasma enters the venous erythrocytes by osmosis (Fig. 15-5). The venous haematocrit (PCV) is larger than the arterial, but the advantage of this water transport is uncertain. This so-called water shift is almost solely due to the shift of anions, secondary to the establishment of a new Donnan equilibrium.Without haemoglobin the transport would be minimal. With haemoglobin most of the CO2 transport is isohydric (it takes place without any change in H+ concentration). The actual rise in venous H+ is also buffered by haemoglobin as by any buffer present. However, the function of haemoglobin is not vital for the CO2 transport.This paragraph covers 1. Hypoxia, 2. Cyanosis, and 3. Carbon monoxide poisoning. Hypoxia denotes oxygen deficiency at the mitochondrial sites due to insufficient delivery of oxygen (low PaO2) or inability to utilise oxygen (normal PaO2). Hypotonic hypoxia is characterised by a PaO2 less than 7.3 kPa (55 mmHg). Below this threshold the ventilation starts to increase by carotid body activity. Acute hypoxia with low PaO2 stimulates the carotid bodies. This triggers a rise in ventilation (primary hyperventilation). The hyperventilation reduces PaCO2 and [H+], which limits the initial rise in ventilation, because it decreases the carotid body and central chemoreceptor stimuli. Symptoms relate to: · CNS: Headache, nausea, blacks out, cramps and unconsciousness (grey out). · The peripheral tissues: Cyanosis of the skin and the mucous membranes (see below). Chronic hypoxia increases breathing in another way. The primary hyperventilation leads to an acute respiratory alkalosis. This disorder is partially compensated by renal excretion of bicarbonate. Hereby, the [H+] returns toward normal. The low [bicarbonate] in the extracellular fluid, including brain interstitial fluid, is partially replaced by lactate from the hypoxic brain. The carbon dioxide response curve is shifted to the left and much steeper than normal. The symptoms of chronic hypoxia are: Nausea, vomiting, lack of appetite, increased ventilation, increased erythropoiesis, increased brain bloodflow, right ventricular failure or cor pulmonale (lung-heart) and mountain sickness. The two types of hypoxia have quite different causes and consequences (Table 15-1).
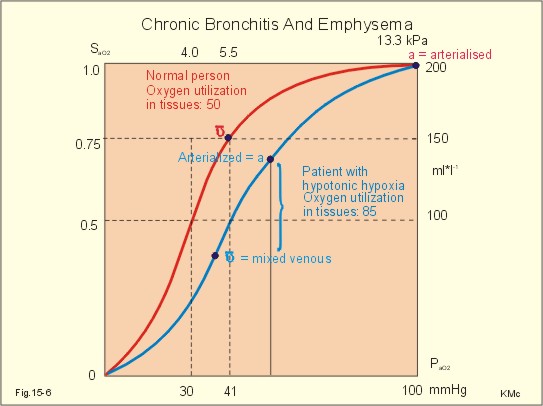
A. Hypotonic hypoxia. The most frequent cause of hypotonic hypoxia is alveolar ventilation-perfusion mismatch caused by chronic bronchitis with emphysema (COLD) in smokers. A typical patient is depicted in Fig. 15-6. The mixed venous oxygen tension is low. Hypotonic or hypobaric hypoxia is caused by insufficient oxygen uptake into the blood from the lungs. Insufficient oxygen uptake also occurs in space, during flying, at altitude and during diving. Hypotonic hypoxia is defined as a PaO2 of less than 7.3 kPa (55 mmHg). Below this threshold the ventilation starts to increase.
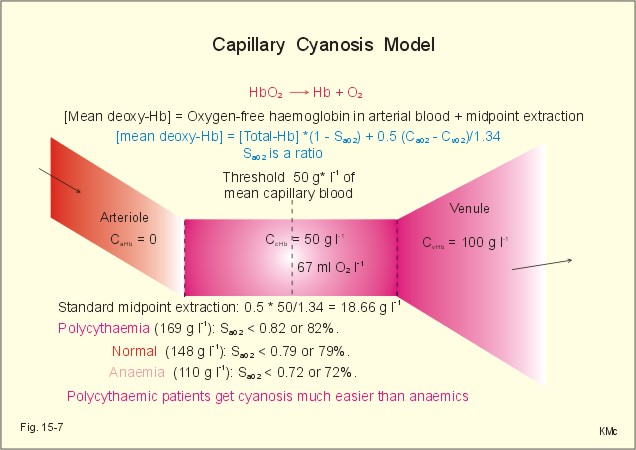
Fig. 15-6: Arterial (a) and mixed venous (v) oxygen tensions on the oxyhaemoglobin dissociation curve of a patient with chronic bronchitis and emphysema. To optimise the efficiency of gas exchange and achieve normal blood gas levels, the alveoli have to be both adequately ventilated and perfused. Abnormal mismatching leads to abnormal V°A /Q°° -ratios and to subsequent hypoxaemia and hypercapnia. Persons with venous-to-arterial shunts and persons with diffusion impairment all have low PaO2 values. Hypoxia also hits persons breathing air with reduced PI02 (reduced PB or reduced FI02 ). B. Anaemic hypoxia. The disorder is due to an insufficient oxygen carrying capacity of the haemoglobin. A blood [haemoglobin] below 130 g per l (8 mM) implies reduced working capacity and thus a consequential anaemia. The normal blood [haemoglobin] is 149-150 g * l-1. Smokers expose their bodies to anaemic hypoxia and to the development of lung cancer. Anaemic hypoxia is a common phenomenon (ex: anaemia and cyanosis; methaemoglobinaemia; cherry-red skin colour in CO-haemoglobinaemia). Ischaemic or stagnant hypoxia is caused by insufficient bloodflow (cardiac insufficiency or local ischaemia). Stenosis of the coronary arteries leads to chest pains or angina pectoris. Arteriosclerosis and stenosis of the leg arteries causes claudication (ie, intermittent walking due to hypoxic pain). The poor circulation in shock conditions is a generalised hypoxic ischaemia. Histotoxic hypoxia is caused by insufficient capacity for oxygen utility. This is caused by blockade of the mitochondrial metabolism as in cyanide poisoning or by blockade of the ATP-production following supramaximal exercise, where the oxygen utility is excessive. Cyanosis means dark blue in Greek and refers to the bluish colour of skin, nails, lips and mucous membranes of healthy persons or patients. The bluish deoxyhaemoglobin in the capillaries determines the degree of visible cyanosis. The amount of deoxyhaemoglobin in the middle of the capillary is a likely indicator. Let us assume that 50% of the deoxygenation occurs in the first half of the capillary, so the mean capillary oxyhaemoglobin concentration is reached here. The mean capillary blood must contain more than 50 g of the bluish deoxyhaemoglobin per l blood in order to be visible (Fig.15-7). The mean capillary concentration of deoxyhaemoglobin ([Hb] in g l-1) is calculated from Eq. 15-2. Cyanosis has one of two causes, which may act together: Reduction of the arterial saturation (low S aO2) or increase in the arterio-venous oxygen content difference. A large oxygen extraction is seen in disorders with low bloodflow. The standard extraction at rest is 50 ml (STPD) of O2 per l or 2.23 mmol l-1. Halfway in the capillary 25 ml of oxygen has been extracted per l (assuming linear extraction). This corresponds to 18.66 g bluish deoxyhaemoglobin per l. The standard extraction relates to a desaturation of the capillary blood of (50* 1.34) = 67 ml of oxygen per l of whole blood.
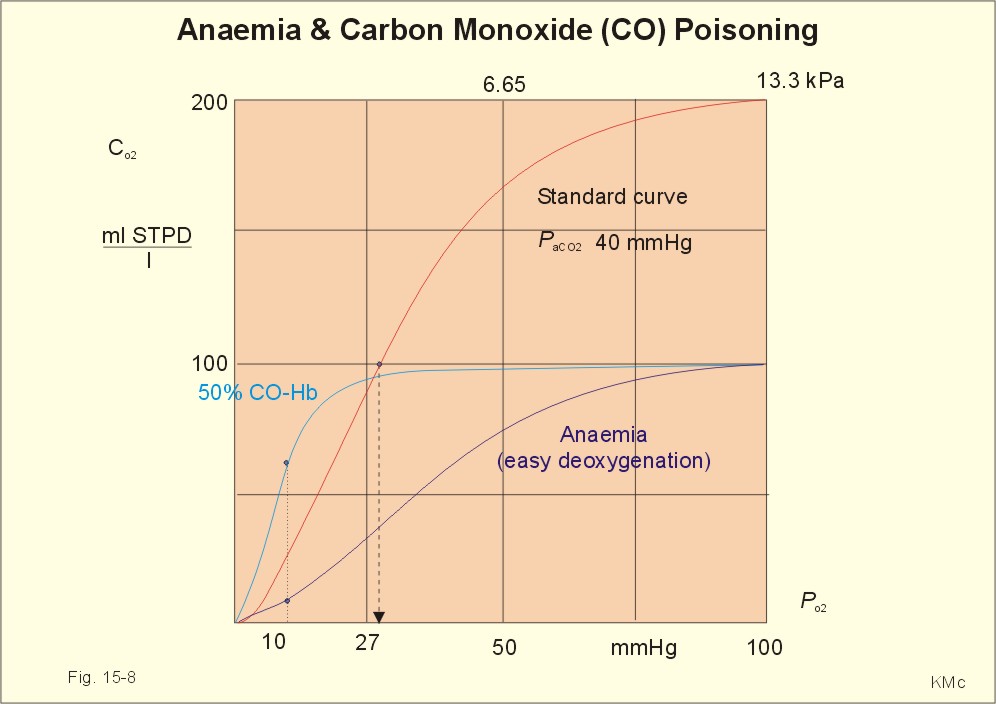
Fig. 15-7: Capillary model with calculations of visible cyanosis in a normal person, anaemia and polycythamia. A patient with a normal [Total-Hb] of 148 g l-1 or 9.18 mM and standard extraction, reaches the cyanosis threshold already at an arterial saturation around 0.79 or 79% (Eq. 15-2). Patients with anaemia only have a minor tendency to become cyanotic. A patient with anaemia and a [Total-Hb] of 110 g l-1or 6.8 mM, must reduce S aO2 to less than 0.72 (72%) in order to reach the cyanosis threshold. Chronical patients with less than 50 g of haemoglobin have no chance of being cyanotic when alive, because the haemoglobin concentration is too small. Polycythaemia patients have lots of red cells and bind large amounts of oxygen. Because of their high [Total-Hb] they become easily cyanotic, despite being well oxygenated. Again it is the absolute amount of deoxyhaemoglobin in the mean capillary blood that determines the degree of cyanosis. Cyanosis is a superficial indicator of hypoxia. A person leaving a cold bath may have dark blue skin and still be well-oxygenated in vital organs. 3. CO poisoningCombustion in insufficiently ventilated areas leads to accumulation of carbon monoxide (CO). Even minimal concentrations of CO in the inspired air prevent the formation of oxyhaemoglobin. In countries with 5% CO in the domestic gas, inhalation of gas is used for suicide. Following one deep inspiration the victim loses consciousness and is chemically dead even before he falls to the floor. CO competes with oxygen for bindings sites on haemoglobin, and thus exposure to CO reduces the oxygen binding to haemoglobin. Persons with a 50% CO-block of a normal haemoglobin concentration have a leftward shift of the oxy-CO-haemoglobin dissociation curve (Fig. 15-8) All the binding sites that are bound to CO do not respond to falling oxygen tension. The remaining oxygen molecules on the haemoglobin molecules are much more avidly bound and unload slower than normal. Patients with CO poisoning and anaemia and with the same arterial oxygen concentration can be compared (Fig. 15-8). At an oxygen tension of 10 mm Hg feeding the peripheral tissues, the CO blood keep most of its oxygen bound, whereas the anaemia blood unload almost all its oxygen (Fig. 15-8). This is why the anaemia patient can go to work and the carbon monoxide poisoned person is dying.
Fig. 15-8: Patients with 50% anaemia and CO-poisoning are compared. A normal standard curve is shown as a red curve. Severe cases survive in coma, which is frequently irreversible. Patients with light carbon monoxide poisoning complain of headache, nausea and vomiting, and have the classical cherry-red skin. The poison can damage the heart and the lungs as well. Prophylaxis is essential, and therapy consists of removing the victim from the CO, and of administering oxygen - if necessary hyperbaric oxygenation. · Fick proposed that the cardiac output can be calculated as the oxygen uptake divided by the arteriovenous oxygen content difference: Eq. 15-1: Q° = V°O2/(CaO2 - CvO2) Standard data for a healthy person at rest are an O2 uptake of 250 ml STPD min-1 and an O2 extraction of 50 ml STPD l-1 or 25% of CaO2. · The mean capillary concentration of deoxyhaemoglobin ([Hb] in g l-1) is easily calculated from the blood haemoglobin concentration [Total-Hb]: Eq.15-2: [mean deoxy-Hb] = [Total-Hb] * (1 - SaO2) + 0.5 * (C aO2 - C vO2)/1.34. The oxygen saturation of the arterial blood is SaO2 and [0.5 * (C aO2 - C vO2)] is 50% of the total oxygen extraction. The constant 1.34 is ml of oxygen per g haemoglobin (the normal oxygen binding capacity). I. A 30-year-old female is anaemic with a haemoglobin concentration of 65 g l-1. Each of the following 5 statements concerning her condition have True/False options: A. A normal PaO2 B. A normal SaO2 C. A rightward shift of the oxyhaemoglobin dissociation curve D. A smaller oxygen capacity than normal E. A PaO2 below normal. II. Each of the following five statements have True/False options: A. Most of the carbon dioxide in the blood is transported in the form of bicarbonate in the plasma. B. Near the terminal bronchioles the movement of air is accomplished by diffusion. C. When blood flows through tissue capillaries carbon dioxide is released from haemoglobin. D: Pulmonary surfactant helps to equalise the distending pressure in alveoli of different sizes by reducing their surface tension. E. The conducting zones of the airways constitute the anatomic dead space. III. Each of the following five statements have True/False options: A. Standard affinity is defined as the reaction rate between oxygen and haemoglobin, when haemoglobin is 50% oxygenated B. Some CO2 is transported dissolved in plasma and erythrocytes C. Some CO2 is transported as bicarbonate in erythrocytes D. More than 1% of the CO2 is transported as carbonic acid E. Some CO2 is transported as carbamino compounds in plasma. A female, 24 years of age, has a PAO2 of 13.3 kPa and a FACO2 of 0.056. Her PCO2 in the mixed venous blood is 46 mmHg or 6.1 kPa and her PO2 is 42 mmHg or 6.0 kPa. The solubility coefficients (a) are 0.022 and 0.51 ml STPD per ml for O2 and CO2, respectively. The barometric pressure is 101.3 kPa, and the water vapour tension in the alveolar air is 6.2 kPa. 1. Calculate the partial pressure of carbon dioxide in the alveolar air. 2. Develop an equation showing the relation between gas concentration © and partial pressure (P) in a fluid (Henry’s law). 3. Calculate the concentration of oxygen and carbon dioxide physically dissolved in one litre of arterial blood in equilibrium with the alveolar air of the above female. 4. Calculate the concentration of CO2 and O2 physically dissolved in her mixed venous blood. A male, age 25 years, exercises with a maximum oxygen uptake of 4.5 l per min, a CaCO2 of 500 ml STPD per l, CaO2 of 200 ml STPD per l, and in the mixed venous blood a CCO2 of 650 ml STPD per l. The CO2 in his coronary sinus is measured at 30 ml STPD per l, and his myocardial oxygen consumption is 420 ml STPD min-1. His RQ is 0.9. One hour later, the male is at rest with cardiac output of 5450 ml per min, and oxygen uptake 273 ml STPD min-1. 1. Calculate his carbon dioxide output and his cardiac output during exercise. 2. Calculate the coronary bloodflow during exercise. 3. What are the energy sources of the heart during exercise and during rest. 4. Calculate the concentration of oxygen in his mixed venous blood at rest, and thus the arteriovenous oxygen difference. A 20-year old person is unconscious after a traffic accident and brought to hospital. No focal lesions are found. A cardio-pulmonary screening reveals the following: Metabolic rate: 10.450 MJ daily, respiratory frequency 14 per min, PAO2 4.5 kPa and PACO2 5.3 kPa. In the mixed expiratory air PEO2 is 15.6 and PECO2 4.4 kPa. Cardiac catheterisation includes the pulmonary artery with mixed venous oxygen and carbon dioxide concentrations: 150 and 542 ml STPD per l of blood. The gas concentrations of the arterial blood are: CaO2 200 and CaCO2 500 ml STPD per l (the radial artery). The dietary energetic equivalent for O2 is here 20.6 kJ per l STPD. The barometric pressure is 101.3 kPa and the tracheal water vapour tension is 6251 Pa. 1. Calculate the respiratory quotient (RQ). 2. What can be inferred from this RQ value? 3. Calculate the oxygen uptake of the patient. 4. Calculate the alveolar ventilation and the dead space. 5. Calculate the cardiac output of the patient. 6. Is the unconsciousness caused by respiratory, cardiovascular or central nervous system malfunction? A healthy person at rest has an O2 uptake of 250 ml STPD min-1 and an arterio-venous O2 content difference of 50 ml STPD l-1. With a normal concentration of O2 in the arterial blood (CaO2 ) of 200 ml STPD l-1 this means that 25% is utilised in the tissues. The body temperature is normal and PaO2 is 13 kPa. The solubility coefficient for oxygen in body- warm plasma is 0.022 ml STPD per ml and per atmosphere (101.3 kPa or 760 mmHg). 1. Calculate the cardiac output at rest. 2. Calculate the concentration of dissolved oxygen in the arterial plasma of this person. 3. Assume that the person is still utilising 25% of the arterial oxygen, and that all the blood is deprived of red cells. Now the person has to survive without haemoglobin. Calculate the hypothetical cardiac output, which would be necessary to provide the cells with sufficient oxygen. 4. Is life without haemoglobin possible for humans ? Try to solve the problems before looking up the answers. · The concentration of physically dissolved oxygen is directly proportional to its partial pressure in the blood. · A metabolite of anaerobic glycolysis called 2,3- DPG (diphosphoglycerate) is highly concentrated in erythrocytes. The highest values are found during hypoxia and during exercise - about 1 mol per mol of Hb4. · The 2,3-DPG, like H+ and CO2, facilitates the unloading of O2 from haemoglobin by reversible changes of its molecular configuration. · The following factors shift the dissociation curve to the right (increase P50): 1. Increasing PC02 (The Bohr effect), 2. increasing [H+], 3. increasing 2,3-DPG, 4. increasing temperature. · The factors that shift the curve to the left (low P50) are: 1. Increasing O2 tension, 2. decreasing [H+] and PaCO2, 3. low temperature in the lungs. 4. Increasing CO tension, 5. Reduced 2,3-DPG production in chronic acidosis, and by 6.Foetal haemoglobin. · The leftward shift in the lung means that more O2 is bound to haemoglobin at a given PaO2 (facilitates the binding of O2 to haemoglobin). · The arteriovenous O2 content difference is typically 50 ml STPD l-1 or 25% of CaO2 at rest with a cardiac output of 5 l min-1. · The pulmonary transfer of O2 and CO2 is perfusion-limited over a wide range of activity levels. · The tissue transfer of O2 and CO2 is diffusion-limited over a wide range of activity levels. · The oxygen capacity of haemoglobin is defined as the volume of O2 that binds to 1 g of haemoglobin at the normal, ambient conditions of 20 kPa (150 mmHg) in partial pressure: 1.34 ml O2 STPD g-1. · Hypoxia denotes oxygen deficiency of the tissues due to insufficient access or insufficient oxygen utility. Hypoxia is present both with low and normal PaO2. · Cyanosis means dark blue in Greek and refers to the bluish colour of skin, nails, lips and mucous membranes of healthy persons or patients. The absolute amount of the bluish deoxyhaemoglobin in the capillaries determines the degree of cyanosis. · Combustion in in sufficiently ventilated areas leads to accumulation of carbon monoxide (CO). · The standard affinity between CO and haemoglobin is 250 fold larger than for the binding of oxygen, so even small concentrations of CO in the inspired air prevent the formation of oxyhaemoglobin. · Inhalation of domestic gas (4-5% CO) is sometimes used for suicide and suicide attempts. -Following one deep inspiration, the victim loses consciousness and is chemically dead even before he falls to the floor. - Some cases survive in coma, which is frequently irreversible. Further ReadingNature. Weekly journal published by Macmillan Magazines Ltd. Porters South, 4 Crinan Str., London N1 9XW. Krogh, A. (1919) “The number and distribution of capillaries in muscles with calculations of the oxygen pressure head necessary for supplying the tissue.” J. Physiol. (London) 52: 409. Nunn, J.F. (2005) “Applied respiratory physiology.” 6th Ed. Butterworths, London.
|
|||||||||||||||||||||||||
.jpg)
Click here to introduce your comments or contributions